Engineering
Shipping Got Easy — Keeping Systems Honest Got Hard
A few years ago, the bottleneck on most engineering teams was obvious: building the thing.
That is less true now. Frameworks, platforms, templates, and AI coding tools made it dramatically cheaper to stand up a feature, a service, a dashboard, or an alert rule. You can go from idea to merged PR faster than most organizations can schedule a design review.
So the constraint moved. The hard part is no longer “can we ship this?” The hard part is “who keeps this true after we ship it?”
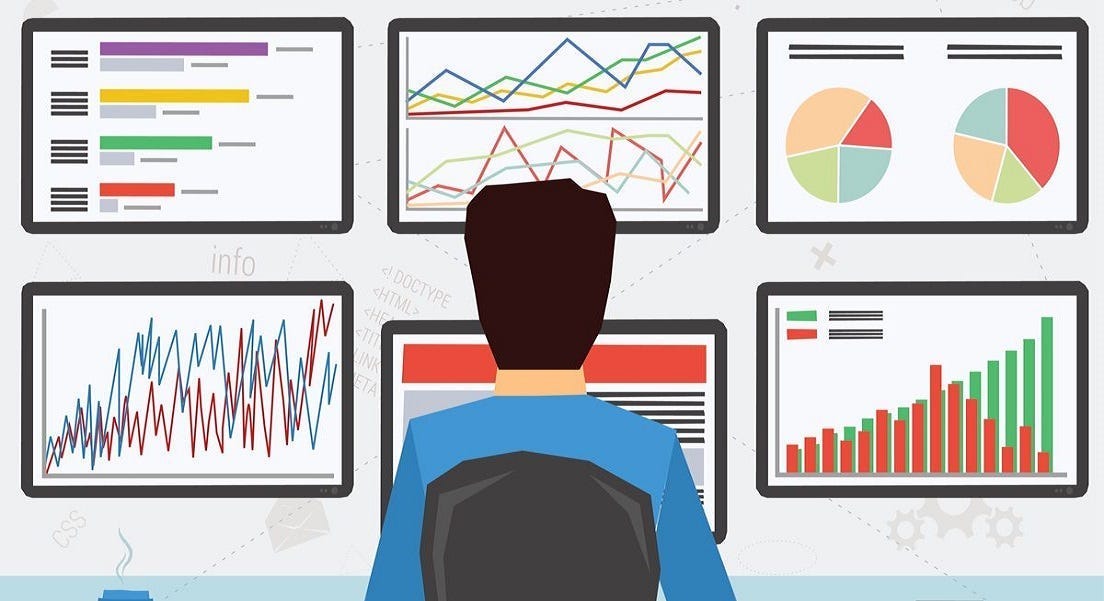
If you own a service, an on-call rotation, or the dashboards people open at 2 a.m., this is for you.
Call it the creation-to-ownership gap: the widening distance between how easy it is to create something and how little capacity anyone budgets to keep it honest afterward.
It shows up everywhere creation got cheap, and ownership stayed optional:
- Feature flags that ship in an afternoon and linger for years
- Dashboards built during an incident and abandoned afterward
- Dependencies added in one PR and audited never, until a CVE forces the conversation
- Alerts added “just in case,” then muted forever
Alerting is the sharpest case study, because bad signal does not just waste time. It trains people to stop listening.
Why alerts stop meaning anything
Every engineering team eventually builds the same thing without meaning to: a monitoring setup that pages people constantly and helps nobody.
It does not happen on purpose. It happens one well-intentioned alert at a time. A threshold after an incident. A Slack notification “just in case.” A dashboard metric promoted to a page. Each addition feels responsible in isolation. Together, they train your own engineers to stop trusting the alarm.
That is the real failure mode. Not that alerting is too quiet. That it is too loud, too often, about things that do not matter, until the one time it is loud about something that does, and nobody is listening anymore.
The fable everyone knows and nobody applies
The boy who cried wolf is not a story about lying. It is a story about signal decay. Every false alarm does not just fail to help. It actively degrades the value of every future alarm. By the time the real wolf shows up, the villagers have already learned, correctly, that responding costs more than it is worth.
Most alerting systems run exactly this experiment on their own engineers, every week, without noticing.
The two costs nobody puts on a dashboard
1. The direct cost, on-call burnout
An engineer who gets paged four times a night, three of which turn out to be nothing, does not sleep less on paper. They sleep less in practice, because the anxiety of an unpredictable pager is its own tax, independent of whether anything was actually wrong. Teams do not usually connect rising attrition or declining on-call morale to alert volume, but it is one of the most direct lines between infrastructure decisions and people decisions in engineering.
2. The invisible cost, trust decay
This is the more expensive one, and it compounds silently. Once an engineer learns that a specific alert is “usually nothing,” they stop treating it as an event that requires full attention. They glance, dismiss, move on. This is a rational adaptation to a noisy environment. Still, it means that when that same alert fires because something is actually wrong, the response time is identical to when it was nothing. The alert has not failed technically. It has failed as communication, which is all an alert ever really is.
Why this gets worse as systems grow
A five-service system can afford a slightly noisy alerting setup because a human can hold the whole picture in their head. That stops being true almost immediately as systems scale:
- More services means more places for thresholds to be set without coordination
- More integrations mean more third-party status changes get treated as “alerts” by default
- More dashboards mean more temptation to wire every visible metric to a notification
- More on-call rotations mean less institutional memory about why a given alert exists at all
Nobody sits down and designs a bad alerting system. It accretes, one reasonable-sounding addition at a time, with no equivalent process for subtraction. Nobody’s job is to remove alerts. Everybody’s job, implicitly, is to add them.
That is the creation-to-ownership gap in miniature. Creation is easy. Subtraction has no owner.
AI coding tools widen it further. They make it even easier to scaffold another service, another monitor, another “temporary” flag, without anyone adding matching capacity to maintain what just got created. Speed of generation is not the same as capacity to own.
There is a second trap that looks sophisticated: the passive monitoring trap. Teams build beautiful dashboards, then assume someone is watching. Nobody is watching on a reliable schedule. Dashboards are opt-in. Pages are interruptive. If critical change only exists on a panel, you have reporting, not response.
What to do instead
This is where most “how to set up Grafana/Last9” posts stop at screenshots. The missing half is design that survives a real on-call rotation.
The only alert filter that matters
Not every signal deserves to interrupt a human.
An alert should exist only if a human needs to take a specific action right now, and that action is not already automated.
Run every candidate alert through that test:
- Informational state changes belong on a dashboard, not a page
- Scripted responses should be automated, not routed to a person
- “Useful context” belongs in a log or thread, not a notification
- Duplicate symptoms of one failure should be one alert, not five
The test is not “is this true and worth knowing.” Almost everything is. The test is whether someone must act now, urgently enough to interrupt whatever they were doing.
If you only take one practical rule from this article, take that filter.
Make the alert itself actionable
A good alert is a work order, not a riddle. When it fires, the person receiving it should not need to reverse-engineer your intentions at 2 a.m.
Bad:
ALERT: cpu_usage_percent{service=checkout} > 80 for 5mBetter:
Checkout p95 latency is above SLO (currently 1.8s, budget burn high).
Users are seeing slow payments.
Open the Checkout first-five-minutes dashboard → Latency panel.
Runbook: https://.../checkout-latency.
If not recovering in 10 minutes, page Payments on-call.
Every page-worthy alert should include:
- What broke in plain language (not only a metric name)
- Why it matters (user impact, SLO risk, blast radius)
- Where to look first (link to the right dashboard panel, not the homepage)
- What to do next (runbook / SOP steps)
- Who else to involve if mitigation stalls (escalation)
If your tool supports advanced fields (investigation guide, false-positive notes, severity, references), fill them. Empty rule metadata is how “create alert” becomes creation without ownership.
Also prefer smarter thresholds where you can. Static lines like CPU > 80 are easy to ship and easy to cry wolf. Prefer symptoms users feel (error rate, latency, freshness, availability) and thresholds tied to history or SLO burn when possible. Threshold alerts, anomaly-style alerts, and trend-change alerts all have a place. Vanity metrics do not.
Route to people who can act
Alert fatigue is often a routing problem disguised as a volume problem.
- Send pages only to people empowered to act
- Keep FYI / deploy / minor blips out of the must-act channel
- Prefer team-owned routes over “everyone engineering”
- Deduplicate and thread: one incident, one conversation, updates instead of five identical pings
Slack made alerting feel cheap. A noisy Slack channel is still a trust failure. It is just quieter about it. Separate must-act from awareness. Thread instead of repeating. Attach the runbook every time.
Build a “first five minutes” dashboard, not a museum
Dashboards and alerts get treated as interchangeable, and they are not.
- Dashboards answer: how are we doing, on a human schedule?
- Alerts answer: does someone need to act right now?
A useful service dashboard for on-call usually covers a small, opinionated set of views. Steal this shape even if your tool is Grafana, Kibana, Datadog, or something else:
- Variables people can change without editing the dashboard (env, service, percentile, time resolution)
- SLOs / user symptoms (availability, latency, error rate)
- Server / API view (traffic, errors, hot endpoints)
- Async/background work if you have queues or cron
- Client view when you have client-side telemetry
- System resources (CPU, memory, runtime-specific stats)
- Dependency health (the thing that usually breaks you at 3 a.m.)
- Alerts section with only the graphs that actually page, plus links to SOPs
Two rules that keep dashboards honest:
- Do not wire every panel into an alert. Pick essential graphs only.
- Alert configuration should not depend on casual dashboard variables. Alerts need fixed evaluation windows and explicit thresholds.
If a panel does not help in the first five minutes of an incident, it probably does not belong on the primary on-call view. Put archaeology elsewhere.
Connect alert → investigation → incident → learning
Mature setups do one more thing tutorials often skip: close the loop.
When a real alert fires, the path should be obvious:
- Alert fires with context and runbook
- On-call lands on the first-five-minutes dashboard
- If it is a real incident, declare/open an incident channel
- Capture timeline and owners
- Afterward, look at detection and response quality (MTTD, MTTR, noisy rules, missing signals)
If alerts never produce learning, the creation-to-ownership gap reopens. You will keep adding rules and never retire the ones that trained people to mute the channel.
What to do this week
Most teams do not need a new alerting platform. They need an audit.
For each noisy alert, ask: when this last fired, did a human take a specific action because of it? If the answer is usually no, that is not a tooling problem. It is an unmaintained list of things somebody once thought were important.
Buying another tool before this audit usually just moves the noise somewhere more expensive.
Practical pass:
- List your top 20 noisiest alerts by fire count
- For each, check the last three fires: what action was taken?
- Delete, demote to dashboard-only, or fix the ones with no action
- Rewrite survivors so they include impact, dashboard link, and runbook
- Rebuild one service dashboard around the first-five-minutes template above
- Put a name next to alert + dashboard hygiene for that service for the next quarter
That is more valuable than another panel.
This is not only about alerts
Alerting is the sharpest example of the creation-to-ownership gap, not the only one. The same pattern shows up in flags nobody removes, dashboards nobody owns, and dependencies nobody audits until something breaks. AI tools accelerate creation without budgeting ownership. If your organization only celebrates shipping, you will keep optimizing the easy side of the ledger.
The teams that age well treat ownership as first-class work: code, alerts, dashboards, flags, dependencies, runbooks. Not as cleanup for when the roadmap has spare room, because it never does.
The real question
Every team believes their alerting system tells the truth until they actually check. The uncomfortable audit is not “do we have enough monitoring.” Almost everyone has plenty. It is “when this last fired, did anyone actually do anything about it, or did they just make it stop.”
If the honest answer is the second one more often than the first, the alerting system is not protecting anyone. It is just training your best engineers to stop listening.
And the broader question behind that one is the title of this piece: now that shipping is easy, who is responsible for keeping what you shipped honest?
How much of your alert volume right now would survive the test: did a human take a specific action because of this?